


This document provides a brief summary of the CO2 global warming issue – and shows why the theory is wrong.
The Phenomenon Global Temperatures have generally increased over the last century (except for the last 10 years) – as has the atmospheric CO2. The United Nations based Intergovernmental Panel on Climate Change (IPCC) has become the definitive authority on the promotion of the anthropogenic CO2 as the cause of the warming and of the justification of scare stories of what the future may bring. The following shows the Hadley Climatic Research Unit global average temperature anomalies (the IPCC uses data provided by HadCRU – plot from: [http://hadobs.metoffice.com/hadcrut3/diagnostics/global/nh+sh/]). The global average temperature has increased about 0.8 degrees C in the last 100 years. 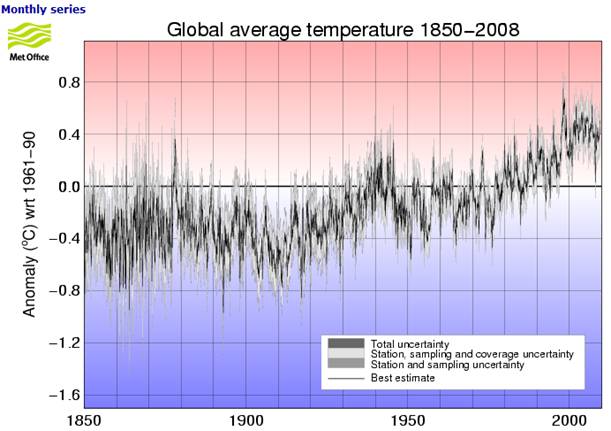 |
The Evidence There is no empirical evidence that anthropogenic CO2 has caused the observed global warming trend – the only evidence comes from the in the computerized climate models based on the assumptions incorporated in the models. The following figure superimposes the above HadCRU temperature anomalies on the IPCC graph of model outputs. (IPCC 2007 AR4 Figure SPM-4 [http://www.ipcc.ch/pdf/assessment-report/ar4/syr/ar4_syr_spm.pdf]) In this figure, the blue shaded bands show the result of 19 simulations from 5 climate models using only the natural forcings. Red shaded bands show the result of 58 simulations from 14 climate models including anthropogenic CO2. This clearly shows that prior to about 1972, the global warming is fully explained by climate models using only natural forcings (i.e. no human CO2). The models need input of CO2 only after about 1970 – prior to 1970 all warming was natural, according to the IPCC. There is no empirical evidence relating CO2 to the post-1970 warming as a causative factor – only the fact that the computer models require CO2 to produce warming. 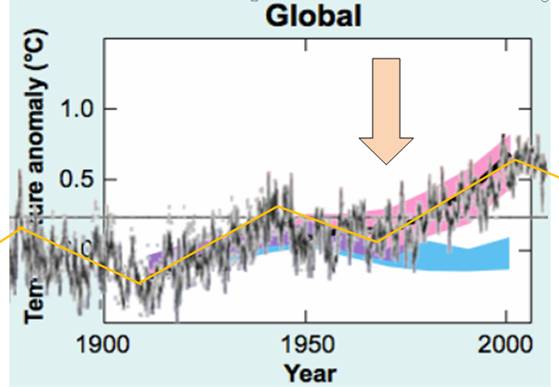 The media stories often report temperature increases over the last century and attribute it to anthropogenic (human caused) CO2 based global warming – but the models indicate that anthropogenic CO2 has only caused warming since the early 1970s. Even though the IPCC released this figure in 2007, it only shows temperatures up to the year 2000 – likely due to the fact that there has been cooling since then (although atmospheric CO2 has continued to increase). This fact is also revealed in the CRU emails released in November 2009: Email exchange between: Michael Mann, Edward Cook and Tom Crowley, May 2, 2001, (Subject: “Hockey Stick” [http://www.eastangliaemails.com/emails.php?eid=172&filename=963233839.txt]). Cook to Mann: “I think that most researchers in global change research would agree that the emergence of a clear greenhouse forcing signal has really only occurred since after 1970. I am not debating this point, although I do think that there still exists a signficant uncertainty as to the relative contributions of natural and greenhouse forcing to warming during the past 20-30 years at least.” |
The following figures show the global temperature anomalies from the Hadley figure shown previously. Two cycles have been highlighted in rectangles: the “natural” cycle (1880-1946: green) and the “CO2-caused” cycle (1942-2008: red), according to the IPCC. The final part of the figure shows the 1942-2008 cycle changed to red and overlaid on the 1880-1946 cycle (vertically shifted by 0.3 degrees). 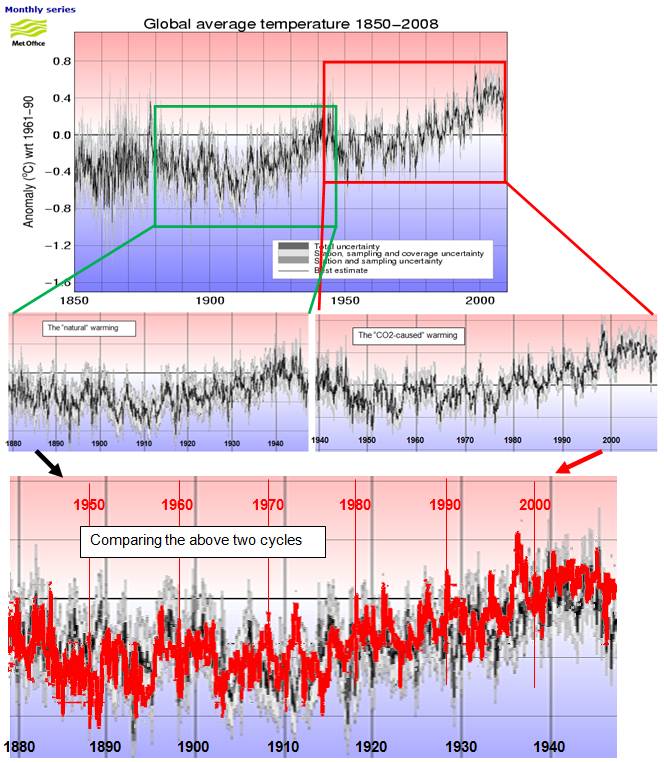 As can be seen from the above figures, the two cycles were nearly identical, and yet the IPCC says the models can explain the early 1900s cycle with only natural forcings, but anthropogenic CO2 is needed for the later cycle. There appears to be a serious problem with the models when two identical cycles have two very different causes. There is an overall upwards net trend in the cycles (about 0.3 degrees C per 60 year cycle) due to the fact that the earth has been warming since the Little Ice Age: “The coldest time was during the 16th and 17th Centuries. By 1850 the climate began to warm.” [http://www.windows.ucar.edu/tour/link=/earth/climate/little_ice_age.html] |
The Satellite Era The following figure shows global average temperature from five data sets since the start of the satellite temperature data era in 1979 (RSS MSU and UAH MSU are satellite data, HadCRUT3, NCDC and GISS are surface station data sets – graph from http://climate4you.com/GlobalTemperatures.htm). From 1979 to 1997 there was no warming trend. The major El Nino then resulted in a residual warming of about 0.3 degrees. Since the 1998 end of the El Nino there has also been no warming trend – all of the warming in the last 30 years occurred in a single year. And yet this is the era that the IPCC says the warming is caused by CO2 – and alarmists are still saying that it’s getting worse, etc.  |
Global? Warming Global warming is not global. The following figure shows the global temperature change from 1978 to 2006 for the lower troposphere from UAH satellite data [http://climate.uah.edu/25yearbig.jpg]. The warming is a northern hemisphere phenomenon – particularly in the Arctic. 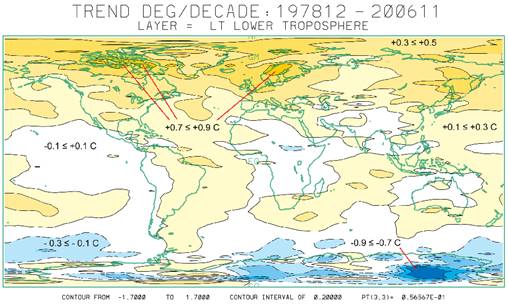 The following figure shows a more recent satellite data trend from the RSS analysis 1979 - 2008 [http://www.ssmi.com/msu/msu_data_description.html]. The left-hand figure shows regional warming around the world, the right-hand figure shows the average warming by latitude – zero warming at 60 degrees S with increasing warming into the Arctic. This illustrates that recent warming is a northern hemisphere phenomenon. 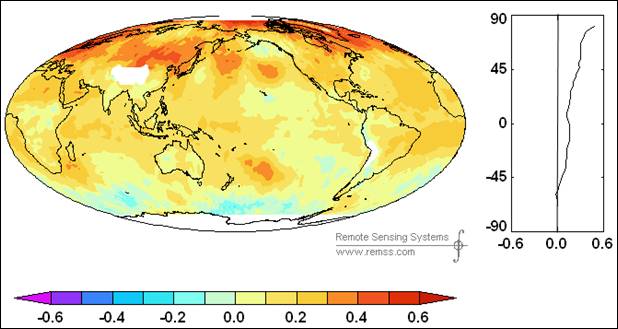 The following figure compares the Arctic temperature trends with global temperature trends.[http://www.frontier.iarc.uaf.edu/~igor/research/aw/index.php] Two observations are evident from this graph: the recent Arctic warming is not unprecedented, and the Arctic warming is much greater than the global warming. 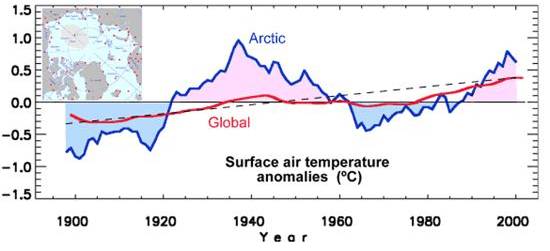 The following figure is from the IPCC Fourth Assessment Report (AR4) Figure 9.6 (2007). It shows the change in temperature (C per decade) by latitude. The black line shows the observed temperature, the blue band shows the output of the computer models including only natural factors, whereas the pink band shows the output of computer models including anthropogenic CO2. Notice that the models without CO2 (blue shaded area) can explain all of the warming for most of the world up to 30 degrees north latitude. This figure also shows cooling in Antarctica with warming increasing in the Arctic.  The following figure shows the average lower troposphere temperature (near the Earth’s surface) from satellite data, for the northern hemisphere (north of 20N), tropics (20N – 20S) and southern hemisphere (south of 20S) (figure adapted from http://climate4you.com/). The northern hemisphere has warmed about 0.5 degrees C, while the southern hemisphere has warmed about 0.1 C and the tropics show no net warming over the 30 years of available satellite data. 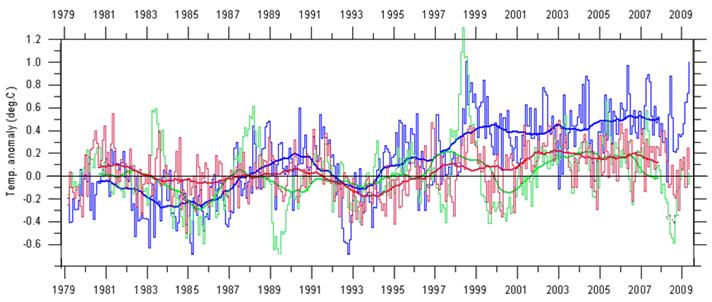 See http://www.appinsys.com/GlobalWarming/GW_NotGlobal.htm for more details on the non-global issue. |
Sea Level Rise / Glacier Recession The IPCC stated in the Third Assessment Report (2001) [http://www.grida.no/climate/ipcc_tar/wg1/425.htm]: “There is no evidence for any acceleration of sea level rise in data from the 20th century data”. The report “Decadal Rates of Sea Level Change During the Twentieth Century” (Simon Holgate, Proudman Oceanographic Laboratory, Liverpool, UK) states: “The first half of the century (1904-1953) had a slightly higher rate (1.91±0.14 mm/yr) in comparison with the second half of the century (1.42±0.14 mm/yr 1954-2003).” [http://meteo.lcd.lu/globalwarming/Holgate/sealevel_change_poster_holgate.pdf] The following figure shows cumulative sea level change for 1900 to 2002. The trend shows no increase in rate since measurements began [http://www.wamis.org/agm/meetings/rsama08/S304-Shum_Global_Sea_Level_Rise.pdf]. Since according to the IPCC, CO2-based warming is only evident since the 1970s, all of this sea level rise since prior to 1970 cannot be caused by anthropogenic CO2, and yet the trend has not increased. Thus sea level rise cannot be attributed to CO2. 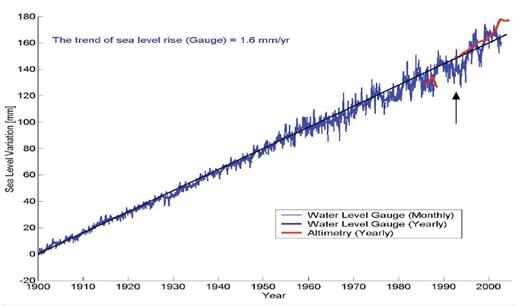 Alarmists say everything is accelerating and it’s worse than expected. But they carefully select start and end dates to create exaggeration. The following figure shows sea level from 1993 to 2009 [http://sealevel.colorado.edu/]. This figure shows a rate of 3.2 mm/year since it starts at a low point in the fluctuating data (the 1993 start indicated by the arrow in the above figure). But the last 6 years exhibit a much lower rate of increase. 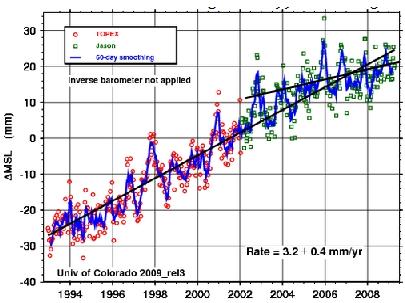 Although Al Gore and other alarmists make statements about scary unrealistic increases in sea level, the IPCC AR4 (2007) report predicts that sea level rise will be 0.6 – 1.9 feet by the year 2100. The larger value is reduced from the IPCC TAR (2001) report which predicted 0.3 to 2.9 feet by 2100. The historic rate of 1.6 mm/yr over the last 100 years translates into a sea level rise of about 6 inches by the year 2100. See http://www.appinsys.com/GlobalWarming/GW_4CE_SeaLevel.htm for more details on sea level change. The same trend is true of glaciers around the world – they have been receding since record keeping began. The following figure shows the composite average of up to 169 glaciers (the number varies in different time periods) since 1700 (Oerlermans,2005 [http://www.searchanddiscovery.net/documents/2008/08068cuffey/cuffey.pdf]), and right – the same curves superimposed on the IPCC graph of model outputs shown previously. Glaciers have been receding since the Little Ice Age and cannot be attributed to CO2. If anything the rate of global glacier recession since 1970 has declined.  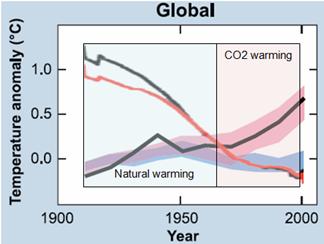 See http://www.appinsys.com/GlobalWarming/GW_4CE_Glaciers.htm for more details on glaciers around the world. |
Problems with Models The CO2-based climate models have been shown to be incorrect. The following figure combines the following: Top: from the International Journal of Climatology. [http://www.scribd.com/doc/904914/A-comparison-of-tropical-temperature-trends-with-model-predictions] comparing the climate models to observations from satellites and balloons(The report stated: “Model results and observed temperature trends are in disagreement in most of the tropical troposphere”); Lower Left: from the IPCC 2007 AR4 Report Chapter 9 – Understanding and Attributing Climate Change [http://ipcc-wg1.ucar.edu/wg1/Report/AR4WG1_Print_Ch09.pdf] providing the climate model based simulation of the expected CO2 “spatial signature” of all forcings including anthropogenic CO2; Lower Right: actual data from radiosonde data, from [http://www.climatescience.gov/Library/sap/sap1-1/finalreport/sap1-1-final-chap5.pdf] showing the actual temperature signature. This further evidence indicates that CO2 is not causing the warming and that there are problems with the models. 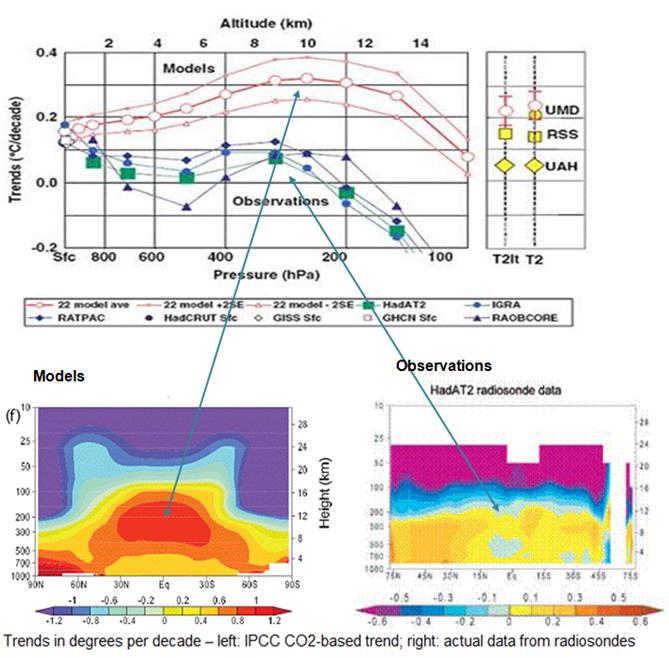 Increasing atmospheric CO2 does not by itself result in significant warming. The climate models assume a significant positive feedback of increased water vapor in order to amplify the CO2 effect and achieve the future warming reported by the IPCC. The specific humidity has been increasing over the last few decades near the Earth’s surface, while it has been decreasing in the upper troposphere. The decreasing specific humidity in the upper troposphere indicates that the warming at the Earth’s surface does not match the CO2 based warming theory. Other studies have found “The upper-level negative trends in q are inconsistent with climate-model calculations ... [this] would imply that long-term water vapor feedback is negative—that it would reduce rather than amplify the response of the climate system to external forcing such as that from increasing atmospheric CO2” and http://www.appinsys.com/GlobalWarming/WaterVapor.htm for more details on problems with climate models. In 1988 NASA’s climate alarmist James Hansen provided temperature predictions based on climate models (the results of which he presented to the US congress to promote the scare). He modeled three scenarios: A had an increasing rate of CO2 emissions, B had constant rate of CO2 emissions, whereas scenario C had reduced CO2 emissions rate from 1988 levels into the future. The following figure compares Hansen’s 1988 predictions with actual temperature data since then. It compares the NASA GISS global data (as compiled by Hansen) with his model projections. (Figure from [http://www.climateaudit.org/?p=3354]). While actual atmospheric CO2 levels have increased since 1988, the fact that actual temperatures are similar to the reduced CO2 models implies a problem with the models – the temperature increase is not due to CO2. 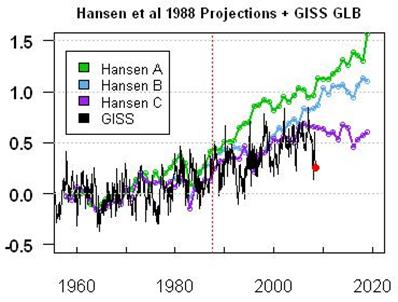 See: http://www.appinsys.com/GlobalWarming/GW_TemperatureProjections.htm for more details on Hansen’s prediction scenarios. |
Possible Causes The scientific method involves making observations (the earth has been warming), forming a hypothesis (it is caused by anthropogenic CO2), testing the hypothesis through further observations and rejecting (or accepting) or revising the hypothesis. Alarmists say that the recent warming must be due to anthropogenic CO2 since we don’t know what else it could be. But that is not a scientific view – an alternative causal explanation is not required in order to reject a hypothesis. And the scientific evidence does not support the CO2 hypothesis. The IPCC (AR4) report (The Physical Basis of Climate Change, 2007 [http://ipcc-wg1.ucar.edu/wg1/wg1-report.html]) states that: “The direct RF [radiative forcing] due to increase in solar irradiance is reduced from the TAR [Third Assessment Report]”. In addition the 4AR states: “There is more uncertainty regarding the influence of solar forcing. In addition to substantial uncertainty in the timing and amplitude of solar variations on time scales of several decades to centuries, which has increased since the TAR although the estimate of solar forcing has been revised downwards”. The problem is that it is not currently understood how the sun can influence the earth’s climate. The IPCC says variation in solar irradiance is too small to have an effect – but the sun’s influence is not just solar irradiance. The following figure (bottom) combines the global average temperature anomalies (top left – from Hadley shown previously) with the total solar magnetic flux (top right – from M. Lockwood, R. Stamper, and M.N. Wild: “A Doubling of the Sun's Coronal Magnetic Field during the Last 100 Years”, Nature Vol. 399, 3 June 1999 which states: “The magnetic flux in the solar corona has risen by 40% since 1964 and by a factor of 2.3 since 1901.” [http://www.ukssdc.ac.uk/wdcc1/papers/nature.html]) 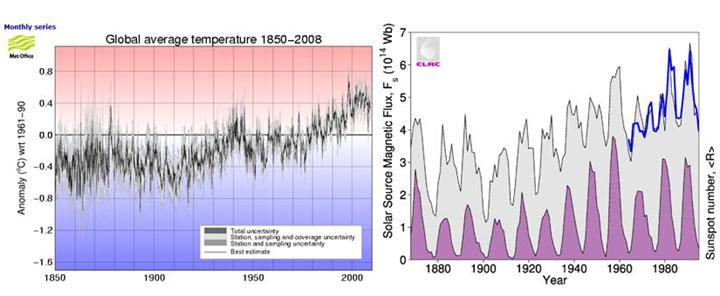  See also: http://www.appinsys.com/GlobalWarming/GW_Part6_SolarEvidence.htm for more details on solar influences on climate. Mars The planet Mars is also exhibiting a warming trend. A 2007 National Geographic article states: “Simultaneous warming on Earth and Mars suggests that our planet's recent climate changes have a natural—and not a human-induced—cause…. Habibullo Abdussamatov, head of space research at St. Petersburg's Pulkovo Astronomical Observatory in Russia, says the Mars data is evidence that the current global warming on Earth is being caused by changes in the sun. "The long-term increase in solar irradiance is heating both Earth and Mars," he said.” [http://news.nationalgeographic.com/news/2007/02/070228-mars-warming.html] The principal investigator for the Mars Orbiter Camera said: “The images, documenting changes from 1999 to 2005, suggest the climate on Mars is presently warmer, and perhaps getting warmer still, than it was several decades or centuries ago” [http://www.abc.net.au/science/news/stories/2005/1464931.htm]. William Feldman of the Los Alamos National Laboratory (who is involved with NASA's Mars Odyssey orbiter) says: “One explanation could be that Mars is just coming out of an ice age” [http://www.space.com/scienceastronomy/mars_ice-age_031208.html]. There’s no anthropogenic CO2 on Mars. But both Earth and Mars are coming out of ice ages. I wonder what causes those. In the late 1800s, the “scientific” consensus was that ice ages did not exist. The current “consensus” is that the sun couldn’t be causing the warming because the mechanism is not understood. Oceanic Oscillations It is only in recent years that scientists are starting to recognize the influence of oceanic cycles in influencing climate. For example, a recent study – “Oceanic Influences on Recent Continental Warming”, (Compo and Sardeshmukh - Climate Dynamics, 2008) states: “the recent worldwide land warming has occurred largely in response to a worldwide warming of the oceans rather than as a direct response to increasing greenhouse gases (GHGs) over land. Atmospheric model simulations of the last half-century with prescribed observed ocean temperature changes, but without prescribed GHG changes, account for most of the land warming. … Several recent studies suggest that the observed SST variability may be misrepresented in the coupled models used in preparing the IPCC's Fourth Assessment Report, with substantial errors on interannual and decadal scales.” [http://www.cdc.noaa.gov/people/gilbert.p.compo/CompoSardeshmukh2007a.pdf] Joseph D’Aleo has conducted a correlation analysis between the Pacific Decadal Oscillation (PDO), Atlantic Multidecadal Oscillation (AMO), CO2 and temperatures [http://icecap.us/images/uploads/US_Temperatures_and_Climate_Factors_since_1895.pdf] and [http://intellicast.com/Community/Content.aspx?a=127]. The following figures compare the PDO+AMO with the US average annual temperatures (left) and CO2 with US temperatures (right). The oceanic oscillations provide a much stronger correlation with temperature than CO2 does. 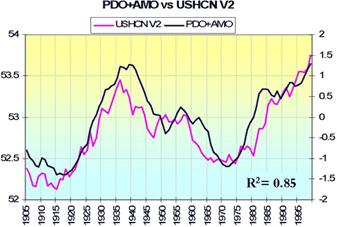  The following figure compares the average annual temperature in Greenland with the AMO (no correlation to CO2).  See: www.appinsys.com/GlobalWarming/PDO_AMO.htm for more details on the oceanic oscillations and relation to climatic phenomena (hurricanes, African Sahel rainfall, Cascade mountain snowpack, etc.) Recent studies are showing that black carbon (soot) plays a larger role than CO2 in causing Arctic warming. A Cornell University study states: “A detailed analysis of black carbon -- the residue of burned organic matter -- in computer climate models suggests that those models may be overestimating global warming predictions. … The findings are significant because soils are by far the world's largest source of carbon dioxide, producing 10 times more carbon dioxide each year than all the carbon dioxide emissions from human activities combined.” |
Deforestation
|
The Reason Since the scientific evidence doesn’t support the CO2 based theory of global warming, why is it being so overwhelmingly promoted by various groups? 1. Power: The alarm was initiated at the United Nations in the 1980s.The original goal was to use it to achieve global governance and fund it through a global carbon tax.
See www.appinsys.com/GlobalWarming/GW_History.htm for details on the development of the global warming scare and original sources for the above quotes. 2. Money: The biggest promoters of the global warming scare are also those benefiting the most monetarily.
See http://www.appinsys.com/GlobalWarming/CarbonMonetization.htm for details on the monetization of the global warming scare and original sources for the above quotes. The United States’ refusal to go along with Kyoto weakened the UN’s plans for a global government. Thus the UN now views the issue more as a means of transferring wealth to Africa and to fund the Millennium Development Goals.
See: http://www.appinsys.com/GlobalWarming/HumanImpact.htm#forum for more details on the MDGs and the UN’s scam. 3. Ideology: The global warming scam is being used as an excuse to promote “social justice” – the developed countries emit fossil-fuel based CO2 and should pay the “developing” countries money.
|
The Politics Politicians in the United States and Europe like the idea of cap-n-trade for CO2. The reason is simple:
But while the governments see it as a revenue source, guess who pays:
|
Other Countries China – the world's largest greenhouse gas emitter – released its plan on climate change in 2007, supporting the rights of developing nations to pursue growth. The Chinese spokesman said "The consequences of inhibiting their development would be far greater than not doing anything to fight climate change … our general stance is that China will not commit to any quantified emissions reduction targets". [www.dw-world.de/dw/article/0,2144,2575639,00.html] In July 2008 the Government of India published a National Action Plan on Climate Change [http://pmindia.nic.in/Pg01-52.pdf]. Section 1.4 of the Technical Document states: "No firm link between the documented [climate] changes described below and warming due to anthropogenic climate change has yet been established." India is taking a pragmatic approach and has no intention of cutting CO2 emissions if it affects its economic growth. The report Overview states: "India is determined that its per capita greenhouse gas emissions will at no point exceed that of developed countries even as we pursue our development objectives." Many Russian scientists disagree with the anthopogenic CO2 theory “Russian critics of the Kyoto Protocol, which calls for cuts in CO2 emissions, say that the theory underlying the pact lacks scientific basis. When President Vladimir Putin was weighing his options on the Kyoto Protocol the Russian Academy of Sciences strongly advised him to reject it as having “no scientific foundation.”” Russian scientists state: "There is no proven link between human activity and global warming. This problem is overshadowed by many fallacies and misconceptions that often form the basis for important political decisions" and "The current warming is evidently a natural process and utterly independent of hothouse gases". [http://www.hindu.com/2008/07/10/stories/2008071055521000.htm] Most of the Japan Geoscience Union members do not believe the IPCC: “Dr Maruyama said yesterday there was widespread scepticism among his colleagues about the IPCC's fourth and latest assessment report that most of the observed global temperature increase since the mid-20th century "is very likely due to the observed increase in anthropogenic greenhouse gas concentrations". When this question was raised at a Japan Geoscience Union symposium last year, he said, "the result showed 90 per cent of the participants do not believe the IPCC report". … Dr Maruyama said many scientists were doubtful about man-made climate-change theory, but did not want to risk their funding from the government or bad publicity from the mass media, which he said was leading society in the wrong direction.” [http://www.theaustralian.news.com.au/story/0,25197,25182520-2703,00.html] |
The U.S. CO2 Emissions The following figure shows global greenhouse gas emissions (GHG) by type from the 2007 IPCC AR4 SPM [http://www.ipcc.ch/pdf/assessment-report/ar4/syr/ar4_syr_spm.pdf]. Note that CO2 fossil fuel use is 56.6 % of GHG globally. In 2004 the United States produced about 22 % of the global fossil fuel based CO2 emissions [http://www.eia.doe.gov/bookshelf/brochures/greenhouse/Chapter1.htm]. Thus, even if the United States eliminated all automobiles and all fossil fuel based electricity generation, etc – global GHG would be reduced by only 12 %. This massive change would have close to zero effect even if the CO2-theory were true.  |
Help Us Transmit This Story
Add to Your Blogger Account
Put it On Facebook
Tweet this post
Print it from your printer
Email and a collection of other outlets
Try even more services
Put it On Facebook
Tweet this post
Print it from your printer
Email and a collection of other outlets
Try even more services


No comments:
Post a Comment