The People's Voice
Michael Collins
 A group of independent researchers caught a pattern of apparent vote flipping during the 2012 Republican primaries that consistently favored Mitt Romney. A form of election fraud, vote flipping occurs when votes are changed from one candidate to another or several others during electronic voting and vote tabulation. (Image: Dean Terry)
Vote flipping is difficult to detect because the vote totals remain the same for each precinct. In one of several possible scenarios, an instruction is given to a precinct level voting machine or to a county-level central tabulator. The corrupted totals from precincts are sent from county election officials to state elections board and published as final results. (Primary documents for this article: Republican Primary Election 2012 Results: Amazing Statistical Anomalies, August 13, 2012 and 2008/2012 Election Anomalies, Results, Analysis and Concerns, September 2012).
The findings showed a consistent pattern of increasing votes and vote percentages for Romney in the precinct vote tally. The pattern emerges when precinct vote tallies are presented by candidate based on the size of a county precinct.
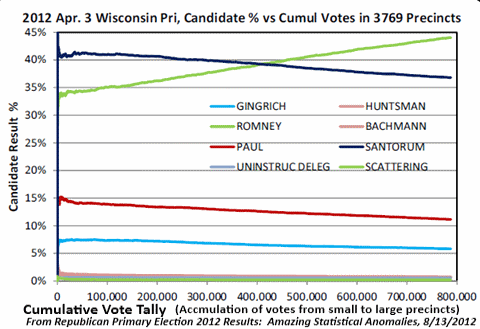
Wisconsin, for example, is represented in the graph below. Moving from the smallest to largest precincts, you can see Romney's percent of the vote takes off and those of the others drop after about 7% of the votes are counted. Romney's percentage of precinct votes goes up (the upward slope of the green line) while those of the three other candidates decline.

The steady increase in Romney's percent of the vote and steady decline in Santorum's represents a statistical anomaly. In this case, the anomaly is amazing according to the researchers. They argue that the probability of this happening by chance alone is so small it exceeds the capability of statistical packages to handle. Their software says Romney’s share of the vote, increasing with precinct size has zero probability of occurring by chance alone.
The significance of the Wisconsin analysis is of grave concern. Presuming the use of appropriate statistical measures and analysis, human intervention is the most likely available explanation.
Vote flipping gave Romney a 57,000-vote victory over Santorum in Wisconsin. Absent vote flipping, Santorum would have won over Romney by about 54,000 according the group's analysis.
Was Wisconsin the only state where Romney’s share of the vote increased in this way as precinct size increased?
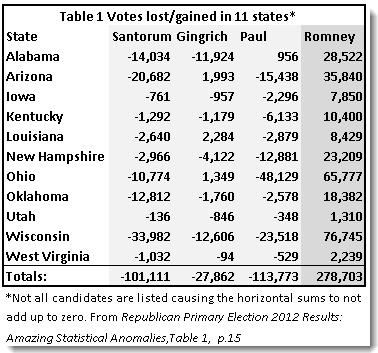
There were eleven states that showed this amazing anomaly, Romney gaining in votes and margins as precinct size increased. The chart below shows the estimated vote flipping for eleven of the fifty states analyzed by the group using precinct-level data.
Estimated Votes Lost/Gained in 11 State Primaries - 2012 - Vote Flipping

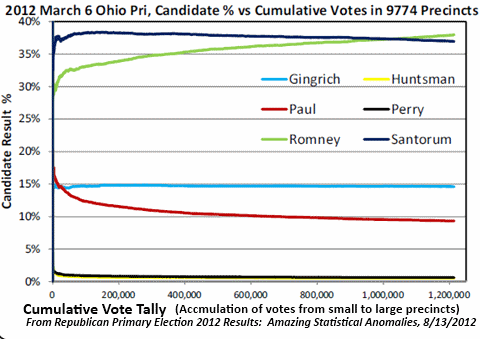
Take a look at data for the Ohio Republican primary. A similar pattern emerges as seen in the graph below. Romney percentages increase from 30% in the smaller precincts to 38% as precinct size increases. The slope of increased votes for Romney violates acceptable levels for probability and must attributed to external intervention. The 65,777 estimated flipped votes provided Romney with a win over Santorum instead of a loss.

New Hampshire offers an even better comparison between precincts that use central tabulators (hand counted paper ballot precincts) and those without. Watchthevote2012.org, a citizen voting rights group, deployed volunteers at 27 precincts on election night to witness all aspect vote counting. Additional data was added for the 79 paper ballot-no tabulator precincts (See "NH Primary Vote Count for Jan 10, 2012" athttp://www.watchthevote2012.com ).
The graphs below reveal the Romney pattern of vote flipping in precincts with electronic voting machines and central tabulators. No such pattern shows up in areas with hand-counted paper ballots.
(Note,Watchthevote2012.org figures for the precincts differ from the published figures by state election officials.) See the graphs illustrating the difference at this link.
One criticism of this research is based on an assumption concerning the demographics of rural, suburban, and urban voters. The argument is that Romney was more likely gain votes as the larger precincts were counted since these larger precincts were closer to cities. City dwellers were presumed to be more sympathetic to Romney than Santorum, Gingrich, and Paul.
The research group considered the demographic question in detail in their second study. Their analysis debunks that presumption and further demonstrates the validity and reliability of the analysis.
The suggested vote flipping favoring Romney is based on 2008 and 2012 precinct data and statistical analysis. The process is transparent as demonstrated by the two papers produced by the groups.
Significance for the 2012 Presidential Election
The probability that systematic election fraud benefited Mitt Romney is a significant concern in the upcoming presidential election. The election is close in battleground states. The stakes are high. The precinct data and analytic techniques used by the researchers are available from the authors for election analysis (see contact information on research papers). Post-election analysis can capture this pattern of vote flipping. But that will be too late.
Public officials and elected representatives need a wakeup call before the election. They need to know about the amazing anomaly described by the researchers. The two research group papers and this article are available for open distribution. Forward one or all of the publications to your county elections division and elected officials. Look for the “County Election Clerk” or “Registrar of Voters” on your county website. The Secretary of State for each state has an election division as well (state boards of elections listing)
Citizen-based exit polling is more important now than ever before. Exit polls by the television networks have been drastically curtailed. They will be conducted in only thirty one states. The media-sponsored exit polls may be of little use in detecting vote flipping. Raw data is rarely offered to citizens for objective analysis. In addition, the media sponsored exit polls presume the accuracy of officially announced vote totals. These pollsters adjust their raw data to conform to the official results.
Citizen exit polling is a vital alternative. Motivated citizens can perform their own analysis of raw data from precincts with the analytic techniques used by the researchers discussed in this article. In addition, experienced researchers with a track record of election fraud analysis should be consulted both before and after November 6.
Election fraud has been a part of politics in the United States throughout its history. From the disenfranchisements of minorities and immigrants to the wide array of suspected election fraud in the2004 presidential election, the perpetrators of election fraud lurk in the shadows awaiting the every-four-year, high-yield opportunity to select the next president of the United States. Vigilance, citizen monitoring, and public discussion are the only protections we have left.


No comments:
Post a Comment